TL;DR
The problem you are encountering is the limited resolution of your speed plus fluctuation plus slightly different approaches to calculate power. And finally, you have to think about the term power at wheels.
What exactly is power at wheels?
I would say, this is the tangential force applied by the wheels onto the street (i.e. the force that's pushing you forward) times speed. But this is not the power delivered by your motor nor the power that accelerates you!
Motor power vs. power at wheels
Some of the power from your motor is already eaten up by friction in the transmission train and by aggregates like air-condition. It's even worse when accelerating: The motor has to spin up all the rotating parts like shafts, gear wheels and wheels, which also takes some power. It's as Zaid wrote, the car feels heavier to the motor than it is.
So the power at the wheels is always lower than the power of the motor. But we can neglect it here, since you are not trying to calculate power at the wheels from motor power. The only point is that the power at the wheels has to spin up the undriven wheels, but let's neglect this, too.
Friction and Drag
The tires experience some friction while rolling on the street, and with higher speed, drag becomes more important. I have no idea about friction, but the power loss due to drag can be calculated by this formula

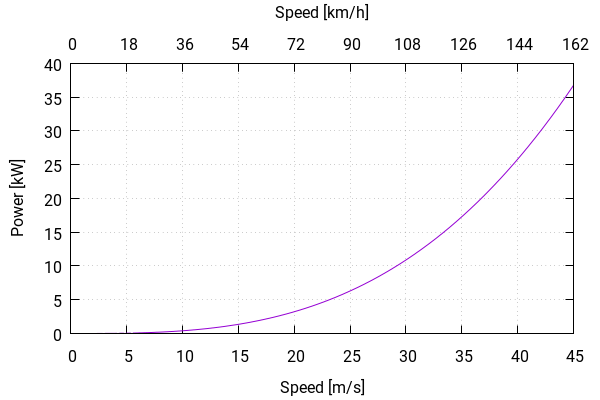
which takes density of air (1.2kg/m³), speed, drag coefficent (0.32 for your car) and cross section area (2.1m² for your car). To get an idea about this, here is a diagram:

At about 100km/h, roughly 10kW of the power at the wheels is already consumed just to maintain speed. Only the excess of power at the wheels is put into acceleration!
Inclines
Depending on if you're driving down- or uphill, the car gains or has to invest energy, which can be calculated via

The formulas
You have given two formulas:

gives the average power needed to change kinetic energy within a given period. This does not reflect that power may vary over time. The instantaneous power can be obtained by choosing shorter and shorter periods. I don't want to bother you with what Mathematicians call deviation, just the result is your second formula:

However, the averaging effect of the first formula can be beneficial if precision of your values is not so good. And since your data was taken once per second, it shouldn't make a big difference which formula you use. BUT the second formula needs acceleration, which is not available in your data and needs to be calculated from subsequent speed values. This also means that both formulas don't give the exactly same result (btw: there are better methods to calculate acceleration):

I used both formulas for your data, and they give quite consistent results for the same source of speed.
Data
OK... Soooo much text, but no look at the data yet, so let's do it.
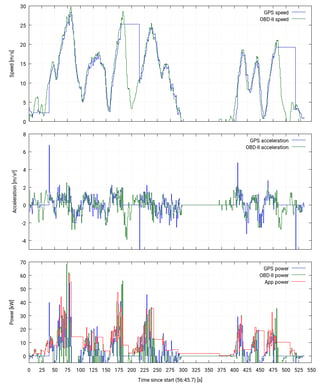
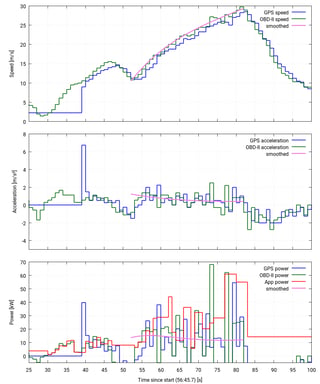
I've prepared two pictures, each showing speed, acceleration and power. The first showing the entire tour, zooms to time range 25-100s. Click to enlarge:


Happily, GPS and OBD speed are mostly consistent, but there's always a small difference as expected, and sometimes, your GPS signal was lost.
But you'll also notice fluctuations, e.g. at 75s and 125s. These jumps up and down are more prominent in the calculated acceleration than the slow trend, which is the real acceleration. So it's clear that the calculated power is a total mess, though the real data seems to be inside there. (It doesn't matter which formula you use to calculate power, the result is the same.)
My Improvement
The second image contains a violet curve, which is a polynom of 4th grade fittet into the OBD speed data to get a really smooth curve, which yet describes the speed well. The deviation of this curve fits really good into the acceleration data. The power data reveals that the acceleration of your car was caused by just about 12kW in the end.
Is this feasible? Your motor has about 64kW@6000RPM, if it's the stronger one. But at that time, it was running at about 3400RPM, and could deliver roughly 36kW. I just assumed that power increased linearly with RPM, which is more or less true. You can easily subtract 10-15% due to friction in the drive chain and 10kW due to drag. Subtract 30% of 12kW (=3.6kW) for inertia, as Zaid wrote, and you get 17kW. This is still more than 12kW, but air-condition, inclines and other effects could easily explain this. (Did you kick the pedal down to the floor?)
What you can do
If you don't know how to fit functions into data (EXCEL doesn't really know), you could try different approaches to smooth your speed values. For example, make a new column and in each row calculate the average of the speed of this row, the row before and after. Maybe, repeat this several times or extend it to the last two to the next two rows.
The Torque app
You may have noticed that even the power calculated by Torque shows some fluctuation, though it seems to be a little smoother. Though I don't know how exactly Torque calculates power, it seems to apply some low level smoothing. Also keep in mind that your smartphone has many more data sources than just speed, it also has a accelerometer and knows its GPS position. It's possible that Torque uses this data too. And finally, GPS data is usually only available once per seconds, the other data more often. My mobile can read out the other sensors 15 times per seconds. The resolution is also higher than what you have in your data. So it's no wonder its calculated power differs from yours.
And: At 58:03.7 Torque claims a power of 60.88kW at 3349RPM, this is impossible for your motor and definitely shows that Torque doesn't give precise data, too...


